

NetFlow accounting
NetFlow provides valuable information about network users and applications, peak usage times, and traffic routing.
Splynx supports NetFlow protocol and calculates statistic information about packets which pass through the Mikrotik router. In this article, it will be shown how to configure your router and Splynx as a collector to receive a traffic statistics for calculation.
Since Traffic Flow is fully compatible with Cisco Netflow, it can be monitored with various utilities that are designed for Netflow e.g. ntop, flow-tools, ManageEngine NetFlow Analyzer etc.
Mikrotik Traffic Flow Configuration Overview
The first thing to do is to enable Traffic Flow on the MikroTik and choose what router interface(-s) to monitor. All of these actions can be done from the command line or from the GUI.
To configure via the GUI - open Winbox and connect to the router (use Wine to run Winbox on Ubuntu). The settings can be found in the menu IP → Traffic Flow on MikroTik:

In Traffic Flow Settings window, put the check mark near the option Enabled, set the interface to where your customer traffic is located.


Cache Entries - number of flows which can be in router's memory simultaneously. The default value: 4k.
But it's recommended to choose a value equal to or greater than 128k:

You might also be interested in the Traffic class tutorial that shows how to exclude the inbound and outbound traffic for specific network(-s) from counting.
The other options that are configurable here:
| Interfaces: | All interfaces from which you want to collect NetFlow data. By default it is set to all. |
| Cache-entries: | Number of flows that the router can store in memory at once. Default is 4k. |
| Active-Flow-Timeout: | Maximum timeout of a flow. Default is 30 min. |
| Inactive-Flow-Timeout: | Period in seconds in which the flow is active. If the connection doesn't receive a packet in that time period, traffic-flow will send packet as a new flow. Default is 15 seconds. |
Apply those changes and click on Targets button.
Then, press 
9995, set Version 5. Click Apply and OK.
The other options that are configurable in the window:
| Src-address: | Source address which you will see in NetFlow collector as your exporter IP. |
| Dst-address: | NetFlow collector IP address (Splynx server IP). |
| Port: | NetFlow collector port on which it is listening. Usually it is 2055, but Splynx uses 9995. |
| Version: | NetFlow packet version. |
| V9-template-refresh: | Number of packets after which template is sent. Only for NetFlow v9 default is 20. |
| V9-template-timeout: | If template has not been sent, send it after this value. Default is 1800. |
Traffic-Flow supports the following NetFlow versions:
version 1- the first version of NetFlow data format, do not use it, unless you have to;version 5- in addition to version 1, version 5 has possibility to include BGP AS and flow sequence number information. Currently RouterOS does not include BGP AS numbers;version 9- a new format which can be extended with new fields and record types due to its template-style design.
Under IP → Traffic Flow, click on Status tab, it should show the Finished and Active flows as seen below:

Now the router starts to send packets with Traffic-Flow information.
Through the CLI on the router, the following commands can be used to send flow records to the Splynx (collector).
Enable Traffic Flow on the Mikrotik router:
ip traffic-flow set enabled=yes cache-entries=4k set active-flow-timeout=30m inactive-flow-timeout=15s interfaces=allSpecify the IP address and UDP port of the Splynx that will receive the Traffic-Flow packets:
ip traffic-flow target add address=192.168.88.100.182:9995 disabled=no version=5command for version: 9
ip traffic-flow target add address=192.168.88.100.182:9995 disabled=no version=9 v9-template-refresh=20 v9-template-timeout=30m
To view your settings:
ip traffic-flow printip traffic-flow target printSplynx Configuration Overview
To add your router to Splynx, open Networking → Routers → Add. In the new window, specify your router options, select NetFlow accounting as seen below:

More information about Routers settings you can find in this article.
In Config → Networking → NetFlow accounting we can change its Daemon and Expire options:


| Accounting options: | |
| Max timeout | Time in seconds when the accounting of the session will be stopped if there is no traffic. The default value is 450 seconds. |
| Max session time | Time in hours when large sessions will be spitted into smaller ones in the statistics. The default value is 24 hours. |
| Daemon options: | |
| Interval | Specifies the time interval in seconds to rotate files. The default value is 300 seconds. |
| Port | Specifies the port number to listen. Default port is 9995. |
| Expire options: | |
| Directory size | Set size limit for the directory. The specified limit accepts values such as 100M, 100MB, 1G, 1.5G etc. Accpeted size factors are K, KB, M, MB, G, GB and T, TB. |
| Maxlife time | Sets the max life time for files in the directory. The supplied maxlife_time accepts values such as 31d, 240H 1.5d etc. Accpeted time scales are w (weeks) d (days) H (hours). |
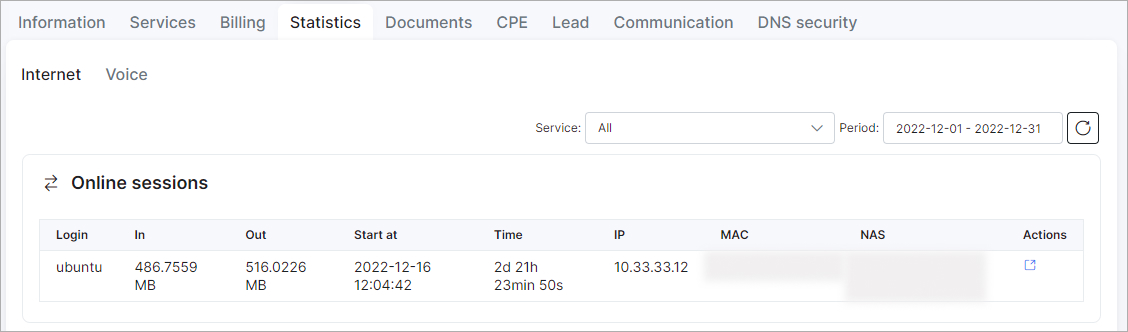
With these configurations set, you should see traffic flowing on Splynx, e.g. open the customer's statistic to double check:

Example of RouterOS v7.2.3 configuration
Step 1:
In Splynx, navigate to Networking → Routers, press Add, specify the router IP and Accounting type:

NetFlow accounting will only work if the SRC IP in NetFlow packets originating from router is the same as IP/Host field value on router's info Splynx page, it will not work if router's outgoing traffic is translated (NAT) to IP that is different from what is entered in IP/Host field. It's better to connect your router with built-in OpenVPN feature for NAS and Splynx to be in the same network.
Step 2:
Go to Customers → List, open the necessary customer's profile, click on the Services tab and open the window to edit their Internet service. Specify the router that this service is connected to, the IP assignment method (pool or static) and the IP address:

Step 3:
If we use Radius on our router to authorize customers, we should disable Radius accounting for services that must be counted by NetFlow:
-
On the MikroTik device, navigate to
IP → DHCP Server → DHCP (tab) → DHCP Configand disable theAccountingoption; -
Open
PPP → Secrets (tab) → PPP Authentication&Accountingand disable theAccountingoption there:

- Navigate to
IP → Hotspot, click on the Server Profiles tab, choose your profile and disable theAccountingoption:

Step 4:
On the MikroTik device, navigate to IP → Traffic Flow, put the check-mark to enable the setting and set the value in the Cache Entries field. Make sure this value is at least 128k, you can increase this value, but this depends on the amount of built-in RAM of the router.

Step 5:
On the MikroTik device, in the Traffic Flow Settings window, click on the Targets button and add Splynx as the traffic flow target:
- add your Splynx IP address to the Dst. Address and type your router IP address to the Src. Address, specify the Port value, it should be
9995and select the Version value -5.

Step 6:
Once the Traffic Flow is enabled on MikroTik router, please wait 5-10 minutes for traffic to appear.
The traffic should be counted from the first finished flow that MikroTik sent to the Splynx nfcapd collector:
Troubleshooting

Splynx uses some scripts from nfdump package to calculate traffic. The daemon nfcapd listens the port and the data can be received there.
When the interval for data collection ends, the data will be written to a file. After that the console script ./var/www/splynx/system/scripts/accounting-neflow is started, it runs nfdump process with the specific parameters, script gets a response and converts it in the acceptable format for Splynx Accounting Proccesor.
To check if the nfcapd daemon is running:
ps -aux | grep nfcapdTo check log:
sudo tail -f /var/log/syslog | grep nfcapd
In the customer's Internet sessions statistics you can notice that the last two sessions are listed without MAC and Session ID values. This is a common condition due to a limitation in NetFlow v5, which results in such data not being passed to Splynx.
